Excel formatting with R
Many times there is a demand from end users to deliver results in a form of Excel files. The bigger and more complex the files grow, the more difficult it is to properly interpret them. This is when nice formatting can help you out.
Recently I was doing quite complex processing in R and was needing an easy to use package for Excel formatting.
My initial attempt to produce nice and colourful Excel reports was with xlsx package. Unfortunately xlsx is a java based package and with 3MB files I quickly started getting java out of memory error messages. After little more digging I came across openxlsx package, which was exactly what I needed. openxlsx is based on C++, which makes it much faster than xlsx and saves you from java memory dependency.
Here I show how easy and pleasant it is to do Excel formatting with openxlsx R package.
Contents
HOW TO
First, as with any R package, you need to have it installed and loaded.
|
1 2 |
install.packages("openxlsx") library(openxlsx) |
Then you can create Excel workbook and add some sheet into it.
|
1 2 |
wb <- createWorkbook() addWorksheet(wb, sheetName = "my sheet", gridLines = TRUE) |
Let’s say you want to add some preprocessed data (my_data) starting from the second row. In the first row let’s do some column merging and colouring.
|
1 2 3 4 5 6 7 8 9 |
writeData(wb, sheet = "my sheet", my_data, colNames = TRUE, rowNames = FALSE, startCol = 1, startRow = 2) # merging 3 first columns from first row mergeCells(wb, sheet = "my sheet", cols = 1:3, rows = 1) # adding fixed text into the merged cell writeData(wb, sheet = "my sheet", "These are merged columns", colNames = FALSE, rowNames = FALSE, startCol = 1, startRow = 1) |
We can apply some nice formatting. First you need to define style and then apply it with addStyle function.
|
1 2 3 4 5 6 7 8 9 10 11 12 13 14 15 |
# to the merged cell headerStyle1 <- createStyle(fontSize = 12, fontColour = "black", haligh = "center", valign = "center",fgFill = "mistyrose", border = "TopBottomLeftRight", borderColour = "black", textDecoration = "bold", wrapText = TRUE) addStyle(wb, sheet = "my sheet", headerStyle1, rows = 1, cols = 1, gridExpand = TRUE) # to the header columns headerStyle2 <- createStyle(fontSize = 12, fontColour = "black", haligh = "center", valign = "center", fgFill = "lightcyan2", border = "TopBottomLeftRight", borderColour = "black", textDecoration = "bold", wrapText = TRUE) addStyle(wb, sheet = "my sheet", headerStyle1, rows = 2, cols = 1:3, gridExpand = TRUE) |
Now you can simply save the output. When you create workbook from the scratch you don’t have to set overwrite flag. It is required though when you want to append some data into already created workbook.
|
1 |
saveWorkbook(wb, output_file, overwrite = TRUE) |
Voila, those are the basics which in a very simple way allow to nicely pump up the report. You can find more openxlsx features in the docs. There are options to insert images, comments, plots, to freeze panels, set footers and more.
Example
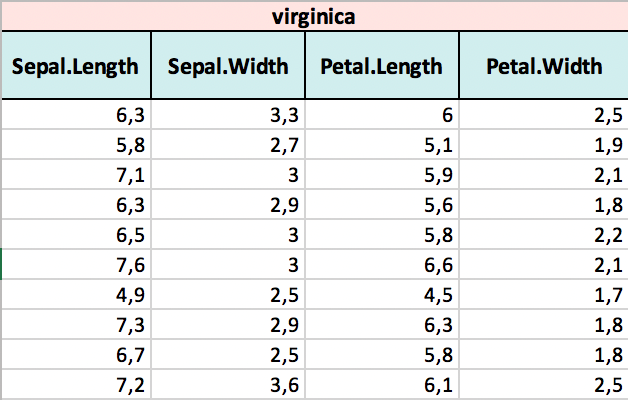
Let’s use well know iris build-in dataset. In this data we have 3 types of iris flowers, let’s save data from each species into separate Excel files.
|
1 2 3 4 5 6 7 8 9 10 11 12 13 14 15 16 17 18 19 20 21 22 23 24 25 26 27 28 29 30 31 32 33 34 35 36 37 38 39 40 41 42 |
iris_by_species <- split(iris, iris$Species) species <- names(iris_by_species) output_dir <- "my_dir" headerStyle1 <- createStyle(fontSize = 12, fontColour = "black", halign = "center", valign = "center", fgFill = "mistyrose", border = "TopBottomLeftRight", borderColour = "black", textDecoration = "bold", wrapText = TRUE) headerStyle2 <- createStyle(fontSize = 12, fontColour = "black", halign = "center", valign = "center", fgFill = "lightcyan2", border = "TopBottomLeftRight", borderColour = "black", textDecoration = "bold", wrapText = TRUE) lapply(species, function(oneSpecies) { output_file <- file.path(output_dir, paste0(oneSpecies, ".xlsx")) if (file.exists(output_file)){ wb <- loadWorkbook(output_file) }else{ wb <- createWorkbook() } addWorksheet(wb, sheetName = oneSpecies, gridLines = TRUE) writeData(wb, sheet = oneSpecies, iris_by_species[[oneSpecies]] %>% as.data.frame() %>% select(-Species), colNames = TRUE, rowNames = FALSE, startCol = 1, startRow = 2) mergeCells(wb, sheet = oneSpecies, cols = 1:4, rows = 1) writeData(wb, sheet = oneSpecies, oneSpecies, colNames = FALSE, rowNames = FALSE, startCol = 1, startRow = 1) addStyle(wb, sheet = oneSpecies, headerStyle1, rows = 1, cols = 1, gridExpand = TRUE) addStyle(wb, sheet = oneSpecies, headerStyle2, rows = 2, cols = 1:4, gridExpand = TRUE) saveWorkbook(wb, output_file, overwrite = TRUE) }) |
Created file: